by Gabriel Pino - CTO & Co-founder of Enline
If you ask a distribution operator for the voltage at a point a few kilometers down the grid, they will usually be able to give you a number. That number is often good enough to work with, but it is almost never a direct measurement from that exact point.
In reality, the operator typically has few credible measurements to process:
- voltages, current and power measured at the outgoing feeder;
- current magnitud measured at reclosers; and
- load curves.
Even the measurements they do have are not perfect. A device might report current with a wide margin of error or signals that are not properly synchronized. These are not “laboratory-grade” measurements, but they are not useless either. They are pseudo-measurements: approximate data points that still carry useful information if you know how much to trust them.
The data a network operator already owns is more valuable than it looks, as long as you understand its quality and limits.
Seeing the whole grid without metering every point
Network State Estimation turns scattered data into a complete picture of the grid. It takes
- the real measurements;
- the pseudo-measurements;
- and the known physics of how electricity behaves on the network;
and then calculates what is happening everywhere else:
- voltage at every node;
- current in every branch (lines, transformers, autotransformers, reactors, etc.);
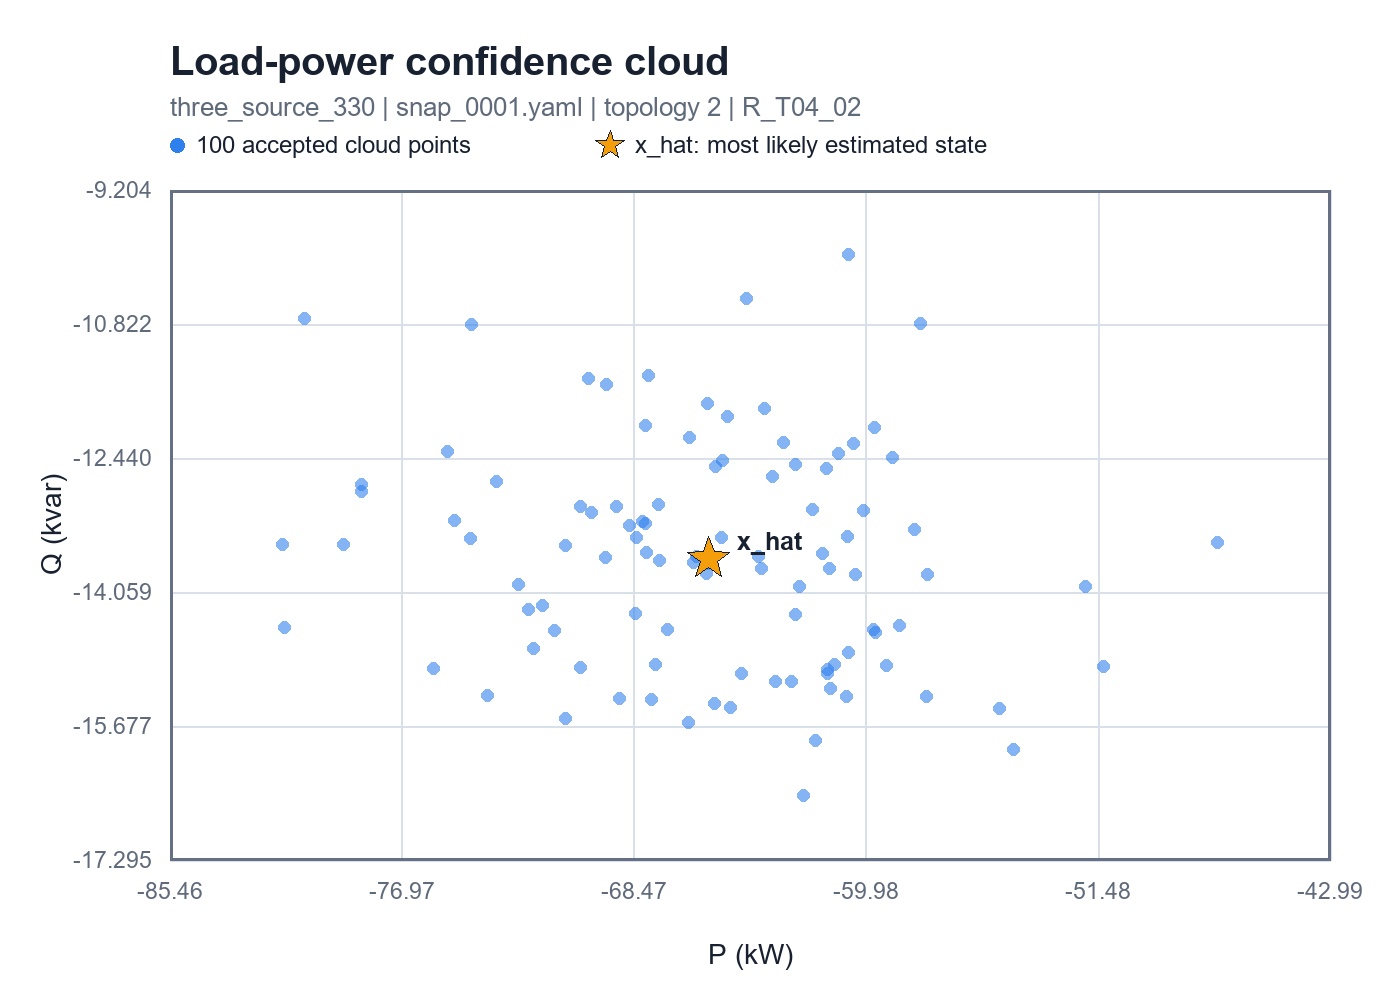
- power injected or consumed at every load bus, each with an indication of how confident the system is in that estimate.
The key benefit: you do not need a meter at every location to understand the whole network.
The electrical and topological state estimation is not a new idea. It has been used for decades in transmission networks, which are well measured, mostly balanced, and have stable, known topologies. The hard challenge is bringing the same capability to distribution grids, which are:
- less measured;
- often unbalanced;
- frequently reconfigured;
- variant on the number of phases per branch;
- variant on the state of switches and taps of autotransformers used to regulate voltage
- and now full of generation as well as load.
That is what separates a module fit for an ADMS (Advanced Distribution Monitoring System) from an DMS: brings intelligence and grid awareness to the table.
Why this became urgent
For decades, distribution operators relied on three rules to fill the gaps between sparse measurements:
1) Power flows using load curves;
2) Phases are balanced closely enough that symmetric components can be used to model the network;
3) Voltage falls as you move out along the grid.
These rules were not shortcuts around measurement; they "were the measurement system". Metering every bus was never affordable and viable, and it still is not. These rules filled the darkness and were “good enough” for most decisions. However, distributed generation has quietly broken all three:
- A single-phase tap with rooftop solar can sit above nominal voltage at midday while the far end of the same feeder sags under evening load – same feeder, same afternoon.
- One phase can behave nothing like the other two, sequence decomposition is no longer viable.
- Power can arrive at the substation instead of always leaving it.
The dangerous part is not that the rules broke, but that they broke without warning. Rules of thumb do not produce alarms when they stop being true. Nothing on the substation display looks unusual, and there is no alert that says “your assumptions are now wrong”.
Many tools that try to fill that darkness rely on yet another assumption: that a feeder sits close to one typical operating voltage. That assumption holds right up to the day when the same feeder is above its voltage limit at one end and below it at the other, which, on a network with distributed generation, is now just an ordinary afternoon.
Field stories: what changes in the control room
1. Non-technical losses
State estimation can help detect places where energy is being used but not paid for. At points where the set of pseudo-measurements are good enough, the estimate of power consumption at specific busses is very tight. At points where the data is loose, those locations are set aside to avoid false accusations.
By combining many snapshots over time, the operator gets an estimate of how much energy was consumed at each point over a week or a month. They can compare that against the energy that was billed. A large, persistent difference indicates non-technical loss: theft, failed meters, billing errors, or unregistered connections. This approach has been used with CFE in Mexico, where a high percentage of the locations flagged by the analysis were confirmed as real issues when inspected.
2. Operating networks with very little visibility
Electrocentro in Peru runs this in real-time on long, rural feeders crossing the central Andes. These networks have:
- single-phase branches;
- most instrumentation concentrated at substations;
- unreliable load curves as pseudo-measurements;
- and low reliability index because they are genuinely hard to operate.
These are not typical networks; they represent the difficult end of the spectrum. A method that works there will cope easily with compact urban feeders.
3. Managing real distributed generation and reverse flows
Because the estimate works with phasors (values with magnitude and angle), it can determine the direction of current flow in each branch, even when the devices only measure the magnitude. The physics fills in the missing piece.
This matters because:
- reverse flows can push voltage up in places nobody expected;
- and can confuse protection systems that were never designed to handle current flowing from the “wrong” direction, including equipment installed less than ten years ago.
In other words, the problem arrived faster than the installed base could adapt.
What makes Enline’s NSE different
This solution is designed to estimate both the electrical state and the topological state of the network, for distribution and transmission grids. It estimates with sincere confidence bound: topology (which switches are open or closed), tap positions of auto-transformer regulators, complex apparent power, and instrument errors all together, rather than in separate steps.
Conventional approach vs Enline approach
Every step is a potential source of error that is never questioned again. Solving all of these together lets the data challenge assumptions, which is especially important during restoration when the real live configuration may not match the one on file.
Confidence is handled per quantity, and the uncertainty bands respect physical limits. For example, when a DER (distributed generation resource) is increased the nodal voltage at its surrounding busses:
- the uncertainty band is short on the side of the limit and longer on the other side;
- and the central value can sit right at the limit.
This is the correct representation: the remaining doubt points in one direction, and a symmetric error bar would be misleading. When the data cannot distinguish between two possible switching configurations, both are returned, with weights, instead of inventing a single over-confident answer.
Poor data is not ignored; it is weighted. Each reading declares its own precision, and that precision governs:
- how much it can move the overall answer;
- how wide the uncertainty band is for any quantity depending on it.
If the declared data is grossly inconsistent, it is flagged before the calculation runs instead of being silently absorbed.
Unbalance is treated as a normal condition, not a special mode. The estimator handles:
- polyphase and single-phase branches,
- single-phase laterals,
- per-phase taps,
- and accepts active power, reactive power, and current magnitudes as pseudo-measurements.
When readings cover more than one phase, they constrain the sum of those phases instead of being artificially divided into three equal parts. Dividing them would create fake information and force an assumption of phase balance that the three-phase model explicitly exists to avoid.
One piece of a larger picture
NSE produces a full set of voltage and current phasors across the network. That output enables:
- detection of non-technical loss,
- dispatch of generation setpoints through a DERMS,
- over- and undervoltage alarms,
- voltage and current profiles along laterals, cables, and lines,
- loss calculations by section,
- phase imbalance analysis,
- and field profiles by section.
In other words, NSE is a component of a network digital twin and ADMS, not a single-purpose tool. It also supports closed-loop operation. A trustworthy state estimate informs a DERMS instruction; generation responds; the network moves into a new condition; the estimate is taken again, and the process repeats until setpoints land where they need to be. NSE is one piece of the broader puzzle of running a modern distribution system — important, but not the whole solution.
NSE is one piece of the broader puzzle of running a modern distribution system — important, but not the whole solution.