See the unseen.

No grid is fully measured. GridSight® NSE uses the physics of the network, not statistical assumptions, to determine what is actually happening across the entire grid. Discover the new NSE tool by Enline.

Direct or pseudo-measurementModeled, not measuredOperating limit
SubstationGuaranteed
The distance between the model’s bound and the operating limit. If the limit sits entirely outside the range, it cannot be violated.Sensors cluster at the substation, and everywhere past it, is a gap.
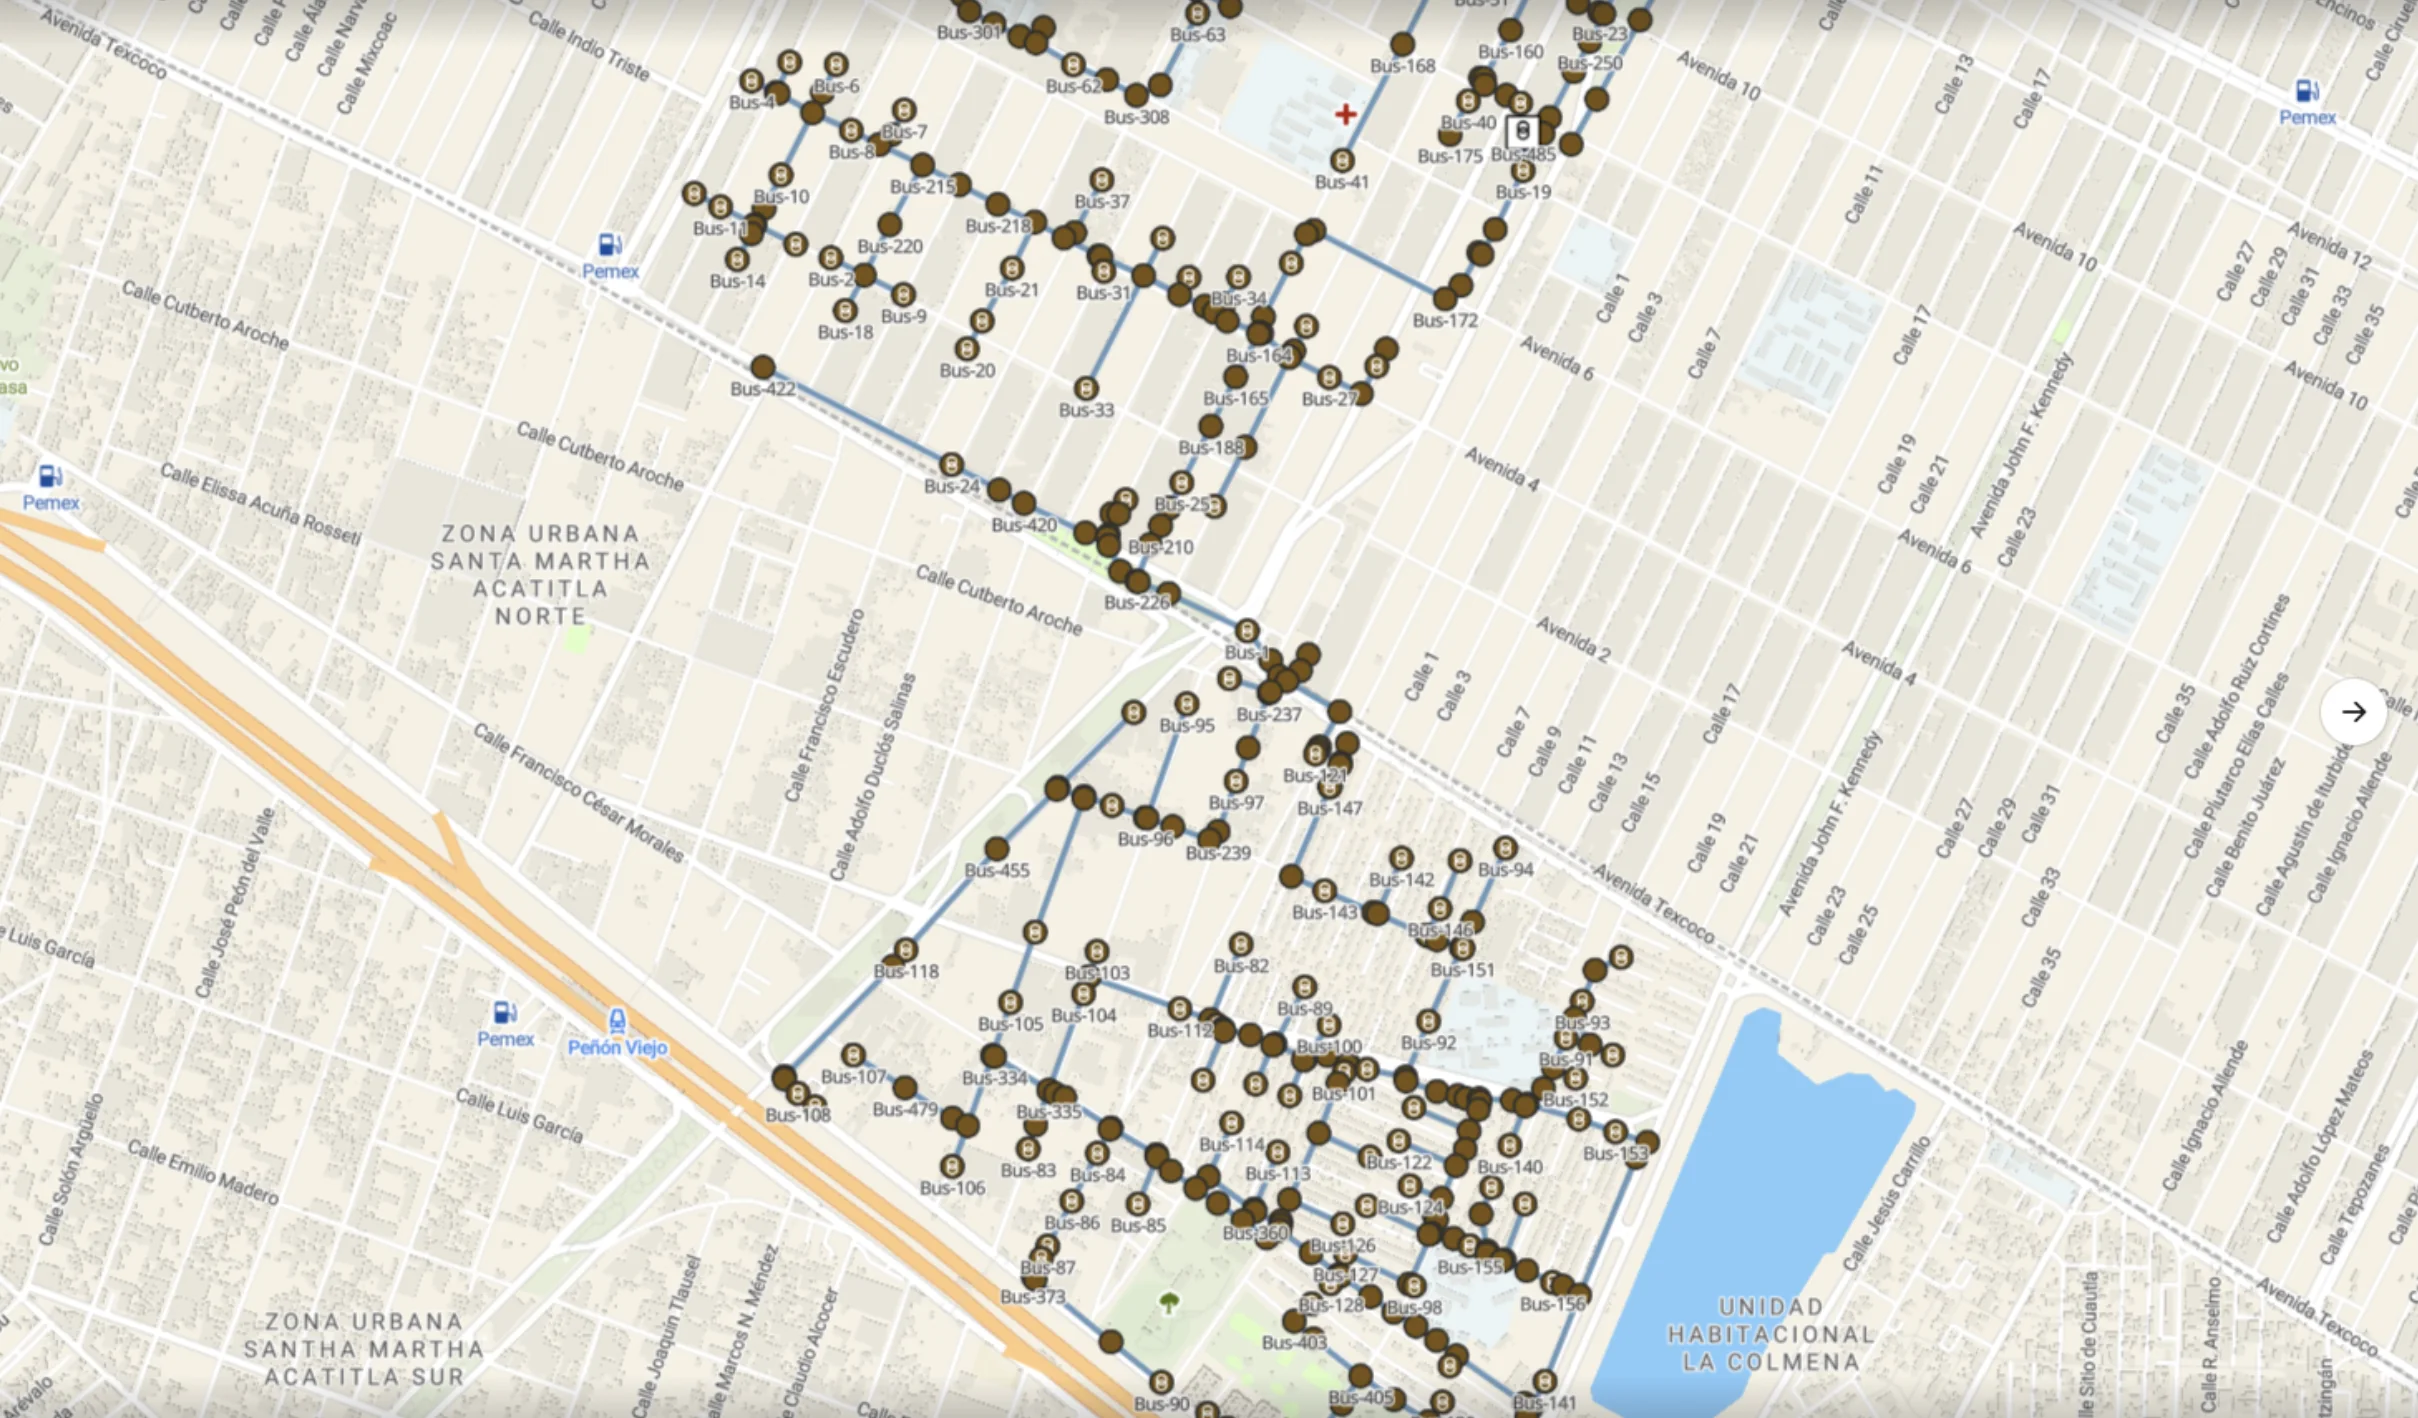
Across one Latin American network, 485 nodes were modeled and only 160 carried a measurement. GridSight® NSE bounds the rest from the physics of the network itself.

The Challenge.

Seeing the grid you can´t see.

To operate the grid safely, operators need to know what is happening across the network.

This is especially true in distribution networks, where most sensors are concentrated in substations, leaving large gaps further down the network. Transmission corridors are comparatively well instrumented but confirming exactly how much more a stable line can carry, still means trusting the electrical state at points no sensor sits on.

The Solution.

GridSight® NSE. One deterministic range, not a guess.

GridSight® NSE infers the complete electrical state of a network - voltage at every bus, current through every branch, power at every point - from the limited measurements that actually exist.

The result isn’t a single number. It’s a bounded range (the feasibility envelope) plus the single most probable point inside it. If an operating limit sits entirely outside that range, it cannot be violated. That’s not a statistical confidence interval you hope holds. It’s a guarantee.

0.016810.016820.016830.0168489.7589.889.85Angle (deg)Current (A)
Probability, 0 to 100%Most probable pointFeasibility envelope

Every state the physics allows, not one guess

A distribution network as GridSight models it: hundreds of buses, each drawn in its real position over the street layout it serves, with the branches that connect them fanning out from the feeder

Why GridSight® NSE.

Know the estimate and how certain it is.

Most tools give a single number and treat it as truth. Enline’s NSE gives a state plus confidence per quantity. That means every voltage, current, and power estimate comes with an uncertainty band that respects physical limits. Honest confidence instead of false certainty.

A guarantee, not a confidence interval.Deterministic bounds mean a limit outside the envelope truly cannot be violated, not just statistically unlikely.

Built for sparse data.Where Weighted Least Squares fails outright, GridSight® NSE still produces a usable, bounded answer.

Reverse flow, without the guesswork.The direction of a reverse power flow comes out of the network physics itself, not confused with a broken sensor.

Sharper with every reading.Every new smart-meter reading, load forecast, or DER estimate narrows the envelope. It never gets less certain, only sharper.

CapabilityTraditional WLSGridSight® NSE
Data requirementNeeds more measurements than unknownsWorks with sparse or minimal measurements
Output when data is thinFails outright, or an unreliable single guessFull feasibility envelope + most probable point
Compliance guaranteeStatistical confidence onlyDeterministic: outside the envelope cannot happen
Reverse flow detectionIndistinguishable from sensor errorDerived directly from network physics
Time to deployNew sensor rollout typically requiredWeeks, from data already reported

Solved together, not one assumption at a time.

Conventional estimators solve each piece in isolation (topology as reported by SCADA, tap positions as reported by controllers, load from a curve) and never question those assumptions again. GridSight® NSE solves topology, tap positions, load, and instrument error together, as one problem.

AssumptionConventional approachGridSight® NSE

Network topology

Taken as given, straight from SCADA

Cross-checked against the network's CIM model, not assumed correct

Transformer tap positions

Trusted exactly as reported by controllers

Treated as another source of error the estimate accounts for

Load per bus

Assumed equal to a weighted load curve

Solved jointly with taps, voltages and switch status: one problem, not four

Field stories.

Real networks. Real certainty.

GridSight® NSE works across the entire grid. From confirming transfer capacity on transmission corridors, to building a complete view of distribution feeders with a fraction of the measurements traditional estimators require.

A Peruvian DSO

13.8 kV, 8 km distribution feeder

Enline modeled the feeder and ingested measurements from connected substations to run real-time worst-case simulations of voltage and current excursions. The feasibility envelope informed maintenance work orders and inspections in advance, reducing outage indicators (SAIDI/SAIFI) through proactive geolocation of anomalies, instead of reacting after the fact.

8 kmFeeder modeled end to end
SAIDI/SAIFI ↓Through proactive anomaly geolocation

Read the Customer Story

Major Latin American DSO

Medium-voltage distribution network

A major Latin American DSO deployed NSE to detect power deviations indicative of non-technical losses across its network. The deployment covered 485 electrically modeled nodes, only 160 of which carried a direct or pseudo-measurement, using 325 real-time readings to compare measured against estimated energy balance, surfacing unexplained deviations as leads for loss investigation.

485 nodesFully modeled network
160 measuredThe rest, estimated
Read the Customer  Story

Why Enline.

Technical Depth. Sector Expertise.

Built by power systems engineers with decades of grid experience, we combine energy-domain expertise with the scientific and digital capabilities needed to reinvent grid operations.

Enline is a team of 55+ engineers, scientists, data experts, and industry specialists. We build technology that helps grid operators unlock more capacity from the infrastructure they already have.

Inside the Grid · Live
Gabriel PinoCTO, Enline

Seeing the unseen grid
with Network State Estimation
.

Distribution is barely measured, unbalanced, and constantly reconfigured.
Join Gabriel Pino, Enline’s CTO, for a live walkthrough of how GridSight® NSE turns the data you already own into a complete, confidence-scored picture of the grid, with real use cases and a live Q&A.

October 1st 2026, 12:00 CET

Format50 min + live Q&A
ForDSOs · LV/MV/HV
Book your seat

See GridSight® NSE
in action
.